Website Analytics
Website Analytics gives you a clear, non-technical view of how people use your site:
- Total Visitors — how many people visited.
- Data Served — how much traffic your site delivered (MB/GB).
You can switch between line and bar charts, change the time range, and export the data.
Open Website Analytics
You can access analytics in any of these places:
-
🏠 Dashboard → Total Website Hosting Plan
Open your plan, then click the Analytics icon on the site card. -
📂 Sidebar → Hosting → Website Hosting
Find your site in the list and click View Analytics. -
📈 Sidebar → Services → Analytics
Select the card for the site you want to review.
ℹ️ Analytics are available for paid plans. Free pages or trials may not include full analytics.
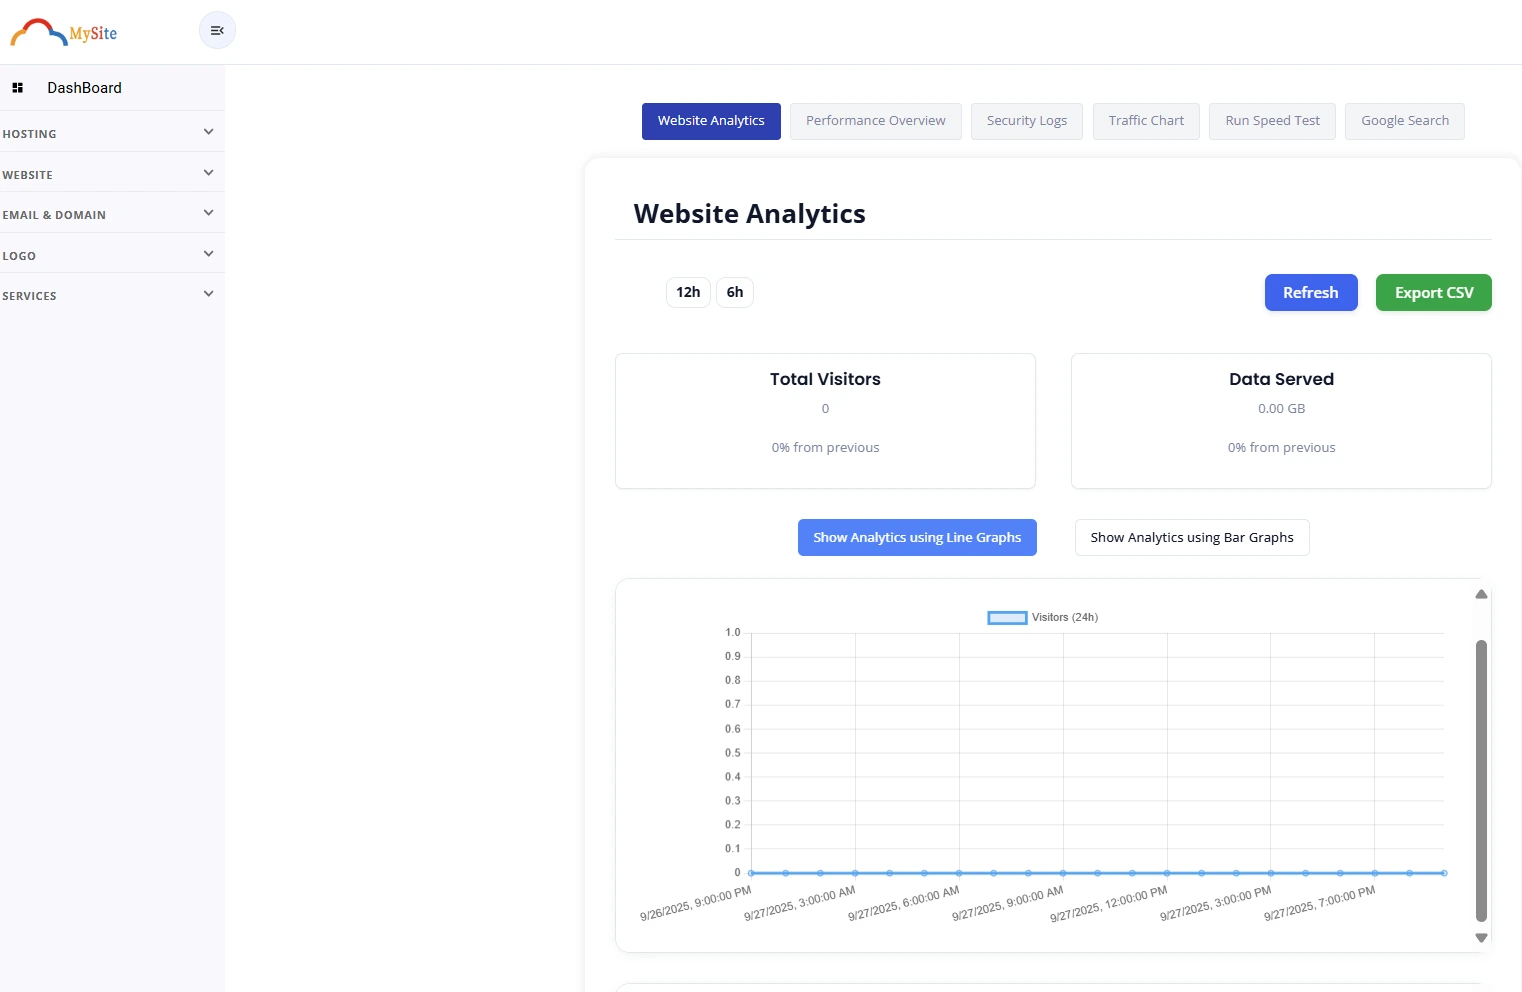
The dashboard at a glance
- Time range buttons (top-left): e.g., 12h, 6h
- Refresh button (top-right): reload the latest numbers
- Export CSV (top-right): download the table data
- Summary cards:
- Total Visitors + change vs previous period
- Data Served + change vs previous period
- Graph type switcher: Toggle Line or Bar graphs
- Charts:
- Visitors Over Time
- Data Served Over Time
Choose a time range
Pick a preset like 12h or 6h. All tiles and charts update to that window.
Use Refresh anytime to pull the latest data in that same window.
🕒 “Change from previous” compares your selected window to the previous one (for example, this 12h vs the prior 12h).
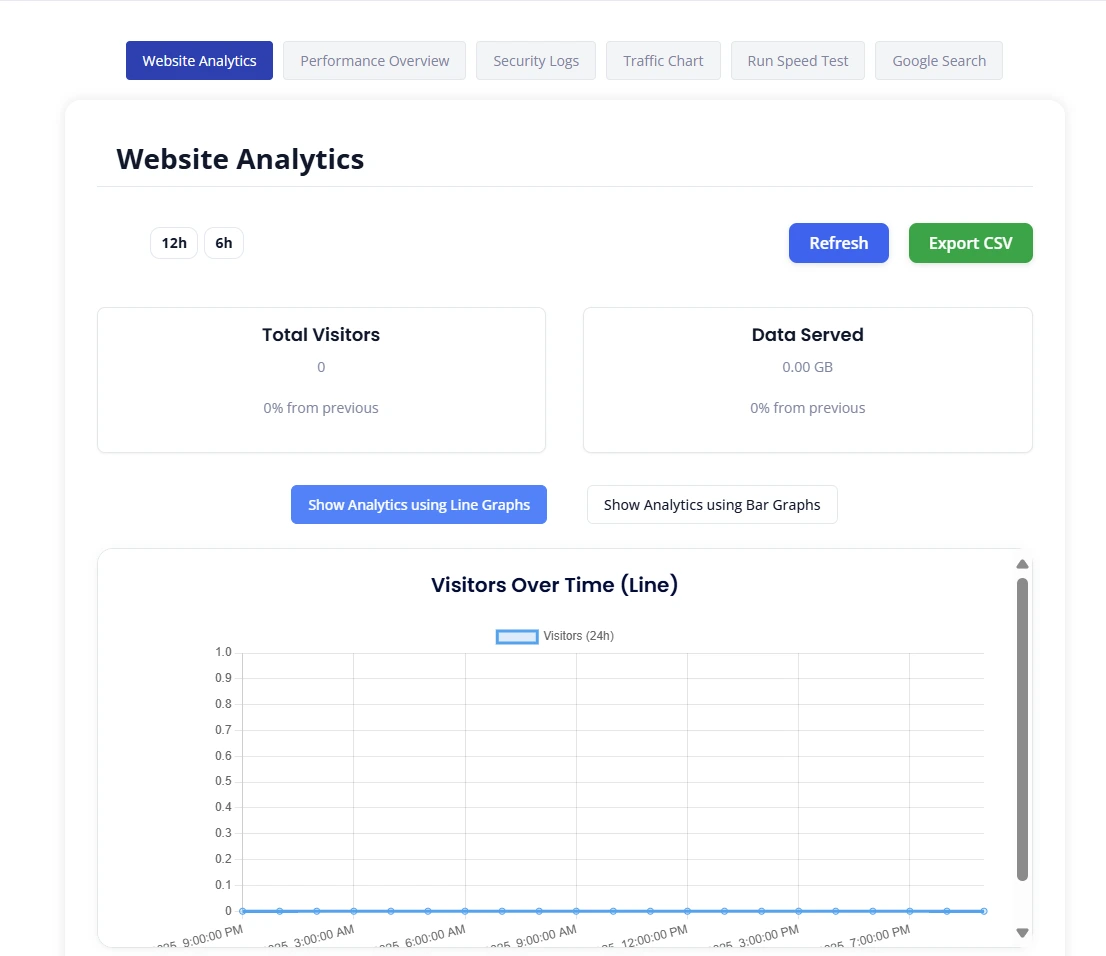
Switch graph types
Some trends are easier to see with different visuals:
- Line graphs show movement over time.
- Bar graphs make comparisons between points clearer.
Use the on-screen toggle to switch views without changing the data.
What the metrics mean
- Visitors (people who reached your site)
Look for peaks that align with campaigns, posts, or announcements.
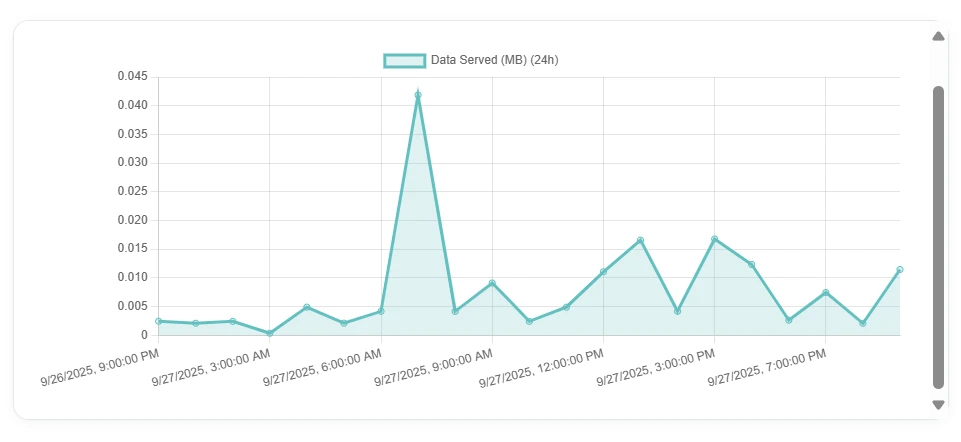
- Data Served (the amount of content delivered)
Spikes can come from popular downloads, images, or video.
-
Status codes (when available)
A quick way to spot errors (for example, lots of 404 or 5xx responses). Seeing these grouped in analytics helps identify where issues might be coming from. -
Cache efficiency (when available)
A “cache hit ratio” shows the share of requests served from cache versus total requests; higher is better for speed and cost.
Tips to read the charts
- Flat visitor lines can simply mean low traffic for that window. Try a longer range.
- One big spike? Check what you published or promoted around that time.
- Rising data served with steady visitors may suggest heavier pages (images/video).
- Frequent errors (status codes) deserve attention—fix broken links or server issues.
Export your data
Click Export CSV to download the current table data. Open it in Excel, Numbers, or Google Sheets to:
- Share a snapshot with your team
- Combine with campaign notes
- Build custom reports
Mobile experience
The analytics page is fully responsive:
- Time range buttons, Refresh, and Export are reachable at the top
- Graphs scroll horizontally if the screen is very narrow
- Cards stack neatly for quick scanning
Privacy & security
- Analytics are rendered by CloudMySite and shown directly in your dashboard.
- Your browser does not need any third-party keys.
Notes & definitions
- What you’ll typically see in web analytics: top pages, countries, device types, and referrers are common views for understanding site usage.
- Cache analytics can help you see if content is served from cache or from your server and why some items miss the cache (plan-dependent).
FAQ
Does changing the time range change everything on the page?
Yes—summary cards and charts update to the selected window.
Why do “Visitors” and “Data Served” sometimes move differently?
The same number of visitors can view heavier or lighter pages, which changes data served.
Can I compare specific dates?
Use the time range that matches your period and compare the change vs previous indicator. More comparison tools are planned.
How often should I check analytics?
Weekly is a good rhythm; check daily during campaigns or launches.
If anything looks off, reach out to CloudMySite Support from the Help menu in the header.