Performance Overview
The Performance Overview gives a friendly snapshot of how your site is doing right now:
- 🧊 Cached Requests — how much traffic is served from the edge (usually faster for visitors).
- 🔒 Encrypted Requests — how much traffic is delivered securely (HTTPS).
- 🛡️ Threats — unwanted or malicious requests that were blocked.
- 🗺️ Requests by Country — where your visitors are located (map & table).
All controls are simple: choose a time range, refresh, or export CSV to share the numbers.
Open Performance Overview
Choose any route that’s convenient:
- 🏠 Dashboard → Total Website Hosting Plan → open your plan → click the Analytics icon.
- 📂 Sidebar → Hosting → Website Hosting → find your site → View Analytics.
- 📈 Sidebar → Services → Analytics → open the site’s Performance Overview.
ℹ️ Full analytics are available for paid plans. Free pages or trials may have limited visibility.
Page controls
- ⏱️ Time range: Quick buttons such as 24h, 12h, 6h.
- 🔄 Refresh: Pulls the newest data for the selected range.
- 📥 Export CSV: Downloads the current view for spreadsheets or reports.
- 🗺️/📋 Map/Table: Toggle between a world map and a country list.
Charts explained
🧊 Cached Requests
Shows how many requests were delivered from the edge cache rather than your origin server.
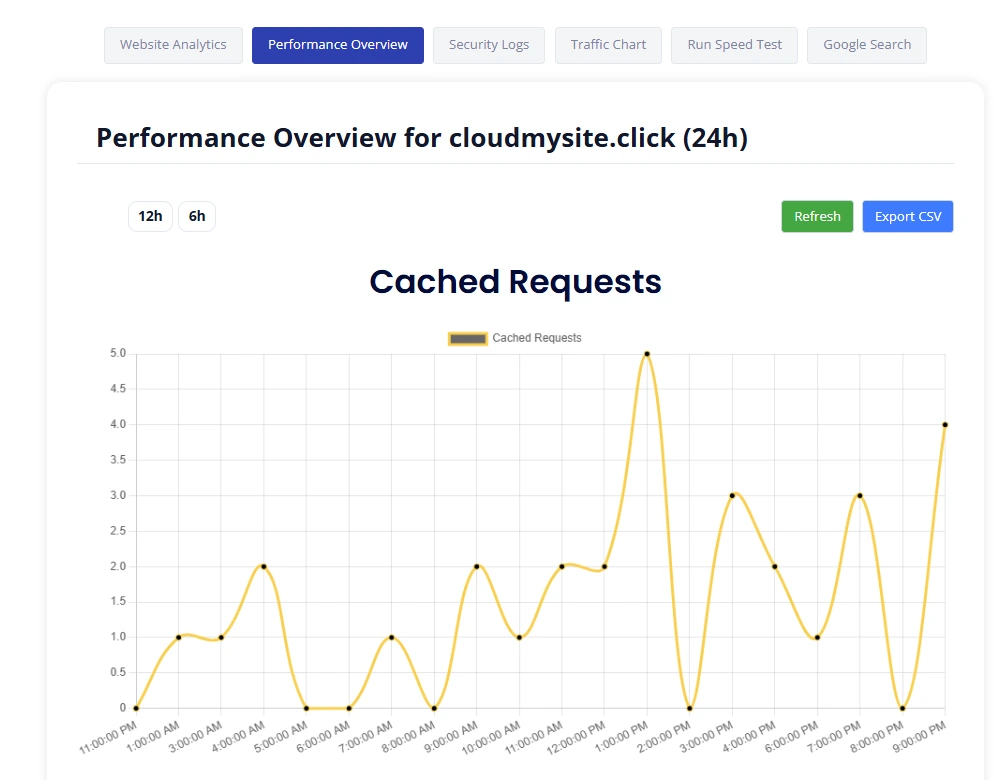
Why it matters: Higher caching often means faster pages and less load on your server.
Reading it
- Steady, higher lines = more efficient caching.
- Sudden dips = new content or settings that bypass cache (for example, frequent updates).
🔒 Encrypted Requests
Shows how much of your traffic is using secure connections (HTTPS).
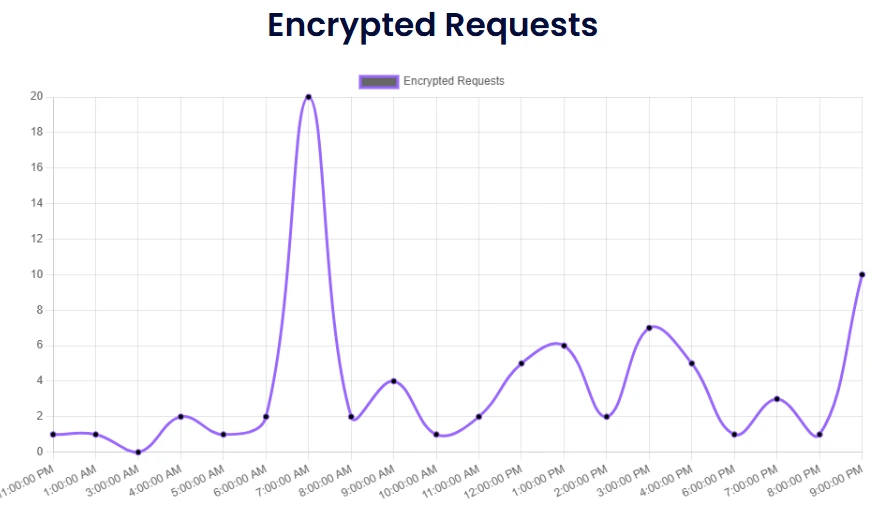
Why it matters: Encrypted traffic keeps visitor data private and builds trust.
Reading it
- Aim for close to 100% encrypted.
- If you see lower percentages, ensure your site forces HTTPS.
🛡️ Threats
Counts requests identified as malicious (for example, known attack patterns or abusive bots) that were blocked.
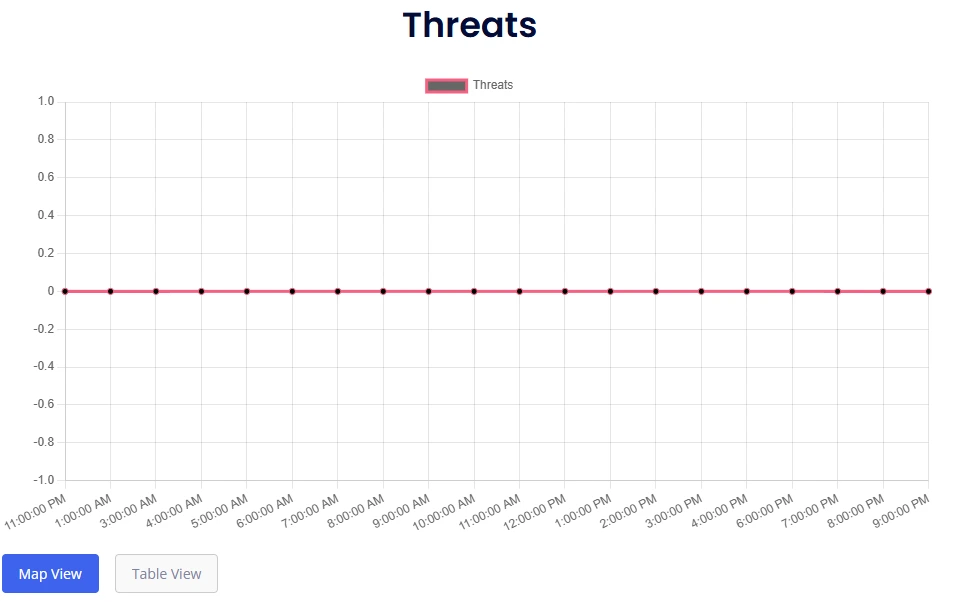
Why it matters: A visible line here means protection is working.
Reading it
- Occasional spikes are normal during scans or probing.
- Frequent or rising spikes? Consider tightening security rules (rate limits, bot challenges).
🗺️ Request Distribution by Country
A heat map (and switchable table) showing where your visitors come from.
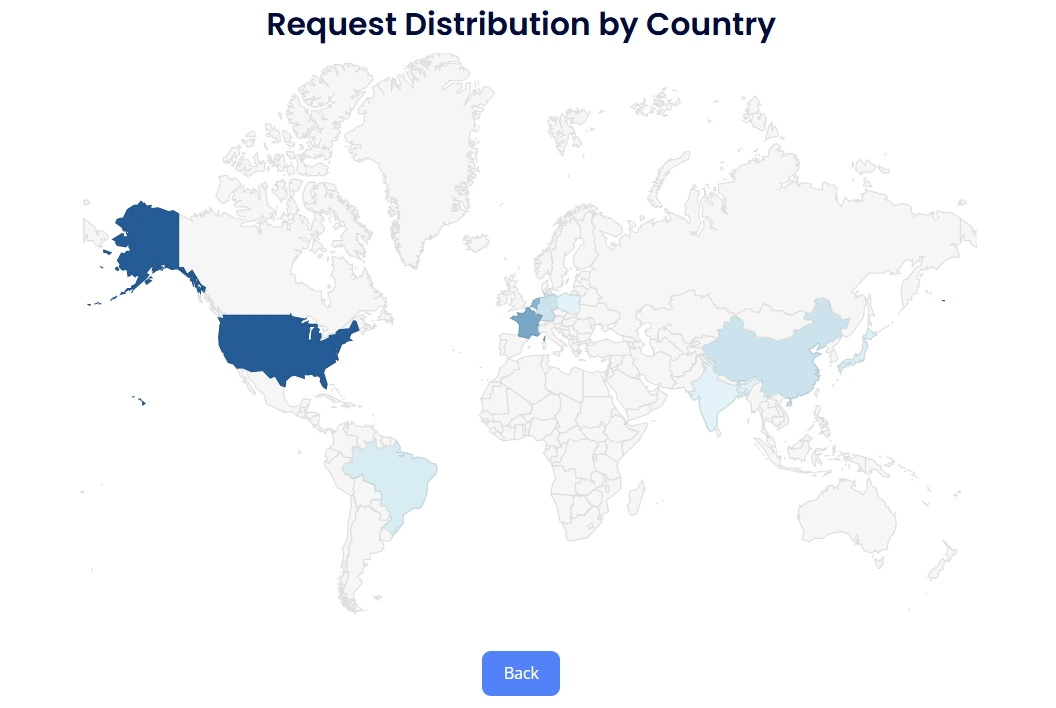
Why it matters: Great for localizing content, planning campaigns, and capacity planning.
Reading it
- Darker regions = more requests from that country.
- Use the Table View to see exact counts and sort by top countries.
Tips to act on insights
-
Cache low?
Make sure images, CSS, JS, and other static files are cacheable. Avoid unnecessary cache-bypass rules. -
Encrypted low?
Enable/force HTTPS so visitors always connect securely. -
Threats high?
Add or adjust security rules (e.g., challenge suspicious traffic, rate-limit repeated requests). -
New audiences appear on the map?
Consider region-friendly content, language, or media schedules.
FAQ
Why do numbers differ from other tools I use?
Time zones, sampling, and filters vary between analytics products. Compare similar windows and definitions.
Why do I see traffic from countries I don’t target?
Global traffic includes bots, crawlers, and shared networks. Protection features manage this automatically.
Can I compare two custom periods?
Use the time range that fits your window, export CSVs, and compare them in a spreadsheet.
How often should I check this page?
Weekly is a good cadence; check daily during launches or campaigns.
Accessibility & Mobile
- All controls are keyboard-friendly (Tab/Enter/Space).
- The map switches to a table on smaller screens for easier reading.
- Buttons are large and clear for touch.
Privacy & Security
- Analytics are rendered by CloudMySite and displayed directly in your dashboard.
- Your browser does not need or receive third-party service keys.
If anything looks off or you’d like help interpreting a spike, contact CloudMySite Support from the Help menu in the header.