Security Logs
The Security Logs view helps you understand potentially risky traffic to your site. It highlights where requests come from, how they trend over time, and makes it easy to share what you see.
Typical questions this page answers:
- Which countries are sending the most suspicious or filtered requests?
- Is there a spike happening right now?
- Do I need to tighten protection or adjust rules?
This page is designed to be non-technical and quick to scan.
Open Security Logs
Navigate using any path you prefer:
- 🏠 Dashboard → Total Website Hosting Plan → open your plan → click the Analytics icon → Security Logs tab
- 📂 Sidebar → Hosting → Website Hosting → find your site → View Analytics → Security Logs
- 📈 Sidebar → Services → Analytics → open your site → Security Logs
ℹ️ Full analytics are available for paid plans.
Page controls
- ⏱️ Time range: Quick buttons like 24h, 12h, 6h
- 🔄 Refresh: Pulls the latest data for the selected window
- 📥 Export CSV: Downloads the current results for spreadsheets or a quick share
- 📊 Graph View / Table View: Switch between a bar chart and a sortable table
- 🧭 Group by: Choose how to organize results (e.g., Country)
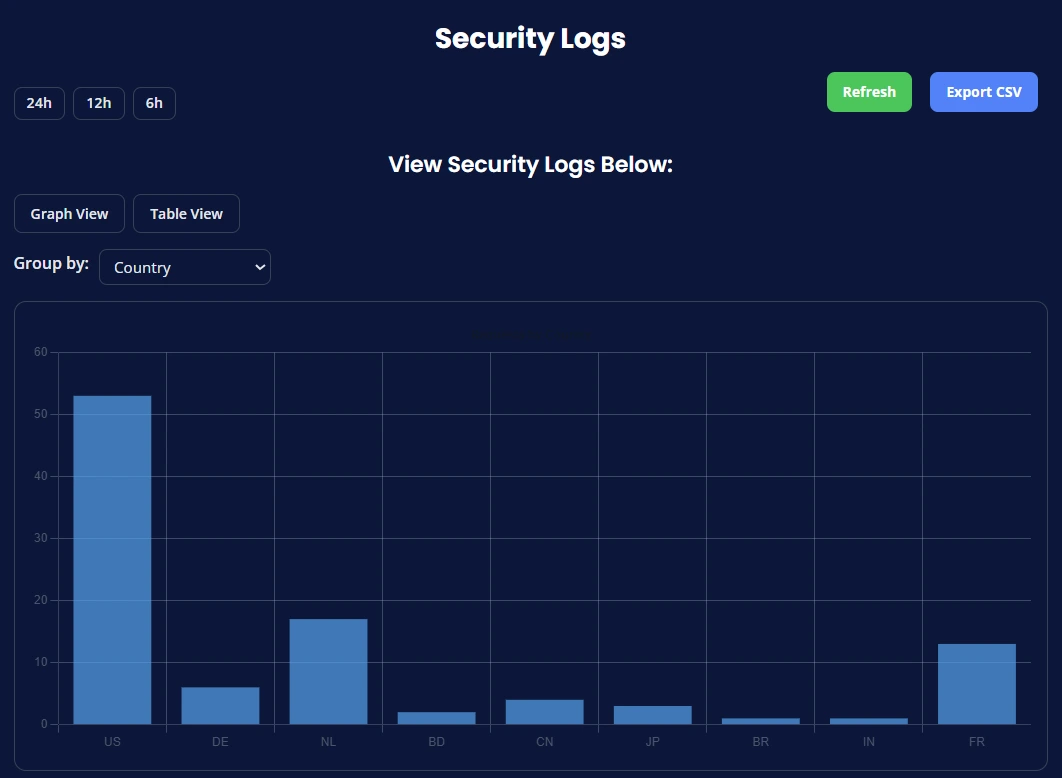
How to read the chart
Bar chart (Graph View)
- Each bar represents the total number of filtered or security-relevant requests for the chosen grouping (for example, Country).
- Taller bars mean more requests in that category.
Table View
- Shows the same information as numbers you can sort and export.
- Great for exact counts or sharing with your team.
Common patterns & what to do
-
One country towers above the rest
This can happen during scans or probing. Consider increasing protection for that region or reviewing recent activity. -
Sudden spike across the board
Often short-lived. If it persists, use Security settings to raise sensitivity (for example, stronger bot checks or rate limits). -
Steady low baseline
Normal background traffic. Keep an eye on trends rather than single peaks.
Practical workflow
- Pick a time range (start with 24h).
- Scan the bars for outliers.
- Switch to Table View for exact counts.
- Click Export CSV if you need to share or archive.
- If something looks off, adjust protection in CloudMySite → Security (non-technical options like stricter bot checks, challenges, or region-specific rules).
Tips
- 📈 Compare windows: Check 12h vs 24h to see if a spike is growing or fading.
- 🌍 Group by Country to locate unusual sources quickly.
- 👀 Refresh after a few minutes to confirm if activity is ongoing.
- 📤 Export CSV before changing settings—handy for audit notes.
Accessibility & Mobile
- Keyboard-friendly: Tab to move, Enter/Space to activate.
- Graphs resize automatically; on small screens, use Table View for easier reading.
- Clear contrast in dark mode aids low-light viewing.
FAQ
Does this page block traffic?
No—this view is for visibility. You can change protection levels in the Security section.
Why do I see countries I don’t target?
The internet is global. Some requests are automated or exploratory. Protection helps filter those.
Why do counts change after Refresh?
Data updates continuously. Refresh just shows the latest totals for your chosen time range.
If you need help interpreting a spike or deciding which protection to enable, contact CloudMySite Support from the Help menu in the header.