Run Speed Test
CloudMySite’s Speed Test gives you an easy, non-technical way to check how fast your site feels for visitors.
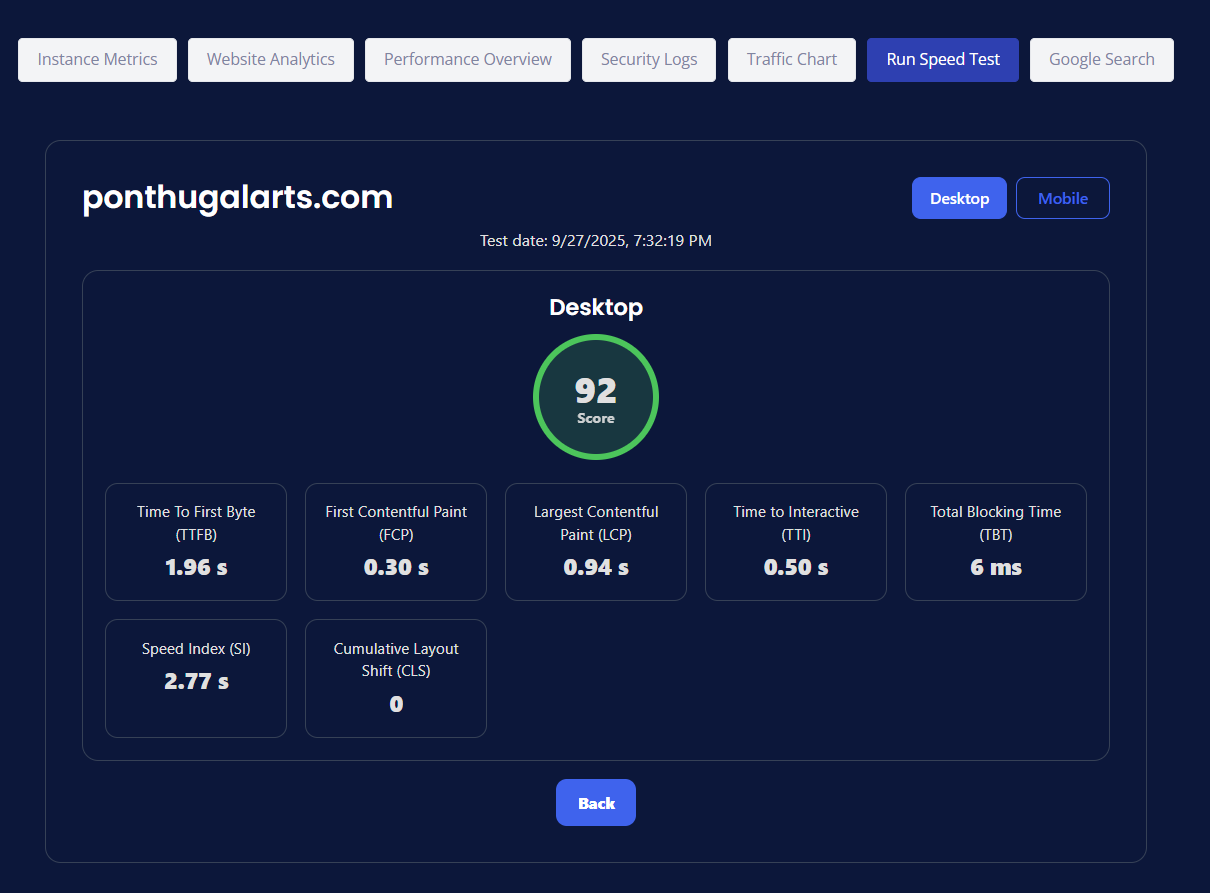
Results are available for Desktop 💻 and Mobile 📱, because people experience speed differently on each.
How to use the Speed Test
- Open Run Speed Test from your site’s analytics.
- Choose Desktop or Mobile at the top-right.
- Start the test. In a few seconds you’ll see:
- A big Score (0–100)
- A set of metrics that explain what influenced the score
- Switch between Desktop and Mobile to compare.
📝 Tip: Run the test a couple of times a day or after publishing updates. Real-world traffic, cache warm-up, and network conditions can change results a little.
What the overall score means
- 90–100 (Great) ✅ — Your site feels fast for most visitors.
- 50–89 (Okay) ⚠️ — Some pages or devices may feel slow; check the metrics below.
- 0–49 (Needs work) ❌ — Visitors may notice delays; use the recommendations in this guide.
Metrics explained (plain English)
The Speed Test shows the following metrics for the selected device. Lower is better for every metric except the score.
| Metric | What it means | What to aim for | Why visitors care | Quick wins |
|---|---|---|---|---|
| TTFB — Time To First Byte | How long your site takes to start responding after someone requests a page. | ≤ 0.8–1.0 s | Slow starts feel laggy before anything shows up. | Use caching; reduce heavy server work on first load; keep images and code on a CDN. |
| FCP — First Contentful Paint | When any content first appears (logo, text, etc.). | ≤ 1.8 s | Instant feedback reassures visitors the page is loading. | Optimize images; inline critical CSS; avoid render-blocking scripts. |
| LCP — Largest Contentful Paint | When the main content (often a hero image or big heading) becomes visible. | ≤ 2.5 s | This is the “page looks loaded” moment. | Compress/resize hero images; preload key images; serve modern image formats (WebP/AVIF). |
| TTI — Time to Interactive | When the page is reliably usable (buttons respond quickly). | ≤ 3.8 s (lower is better) | Visitors can actually click and scroll without stutter. | Defer non-critical JS; split large bundles; remove unused plugins. |
| TBT — Total Blocking Time | How long the page was “blocked” by heavy scripts while loading. | ≤ 200 ms | High TBT makes pages feel unresponsive. | Minify JS; lazy-load widgets; move third-party scripts later. |
| Speed Index (SI) | How quickly content appears during load (visual progress). | As low as possible (often < 3 s on desktop) | Smoother visual progress = calmer visitors. | Prioritize above-the-fold content; reduce layout thrash; enable HTTP/2/3. |
| CLS — Cumulative Layout Shift | How much the page jumps around as it loads. | ≤ 0.1 | Shifting content causes mis-clicks and frustration. | Reserve image/video space with width/height; avoid inserting banners above content. |
🎯 “What to aim for” are friendly targets, not strict pass/fail rules. Improving any metric generally improves the overall score and the actual feel of your site.
Desktop vs Mobile: what changes?
- Network: Mobile often simulates slower or inconsistent connections.
- CPU: Phones can be less powerful than laptops; heavy scripts show up more on Mobile (TTI/TBT).
- Layout: Smaller screens reveal layout shifts (CLS) you might not notice on Desktop.
How to compare
- Test Desktop first to confirm your site is healthy.
- Switch to Mobile to catch scripting and layout issues that only show on phones.
- Prioritize fixes that help both (images, caching, deferring non-critical scripts).
Read your results like a pro (non-technical)
- Look at the score donut: Above 90? You’re in great shape. If not, don’t worry—use steps below.
- Scan the metric tiles: Anything highlighted or much higher than others is your first target.
- Fix in this order (usually gives the biggest wins):
- Images — resize, compress, use modern formats; preload the hero image.
- JavaScript — defer or lazy-load non-critical scripts; trim unused plugins.
- Caching — enable page/static caching so repeat views are instant.
- Layout — set width/height on images and embeds to stop content jumping (CLS).
- Re-test on Desktop and Mobile to confirm the improvement.
Examples (how to interpret)
-
Great LCP (0.9 s) but high TBT (600 ms)
The page looks loaded fast but feels sluggish when clicking. Focus on deferring heavy scripts and splitting bundles. -
Good TTFB (0.6 s) but slow LCP (4.0 s)
Server starts quick, but the main content shows late—likely large hero media. Compress and preload the hero image or video. -
Low CLS (0.01) — nice!
Content is stable. Keep reserving space for images, ads, and embeds.
Frequently asked questions
Why do results vary between runs?
Traffic, caching, and network conditions change throughout the day. That’s normal. Compare trends, not single points.
Do I need a perfect 100?
No. Anything 90+ is excellent. Focus on making the site feel fast for visitors.
Does the score affect search ranking?
Speed can influence visibility, but great content and reliability matter too. Aim for a balanced approach.
Should I optimize every single page?
Start with your homepage and highest-traffic pages, then work down.
Checklist for quick wins
- 🔲 Compress & resize images; use WebP/AVIF where possible
- 🔲 Preload the hero image and critical fonts
- 🔲 Inline critical CSS; load the rest later
- 🔲 Defer or lazy-load non-essential JavaScript (analytics, chat, widgets)
- 🔲 Remove unused plugins, themes, and third-party scripts
- 🔲 Enable caching so repeat visits are instant
- 🔲 Set explicit width/height for images and embeds to prevent layout shift (CLS)
Next steps
Run the test again after changes. If a metric still looks high, target the related fixes from the table above.
Need a hand? Reach out to CloudMySite Support from the Help menu—we’re happy to review your results and suggest specific improvements for your site.