Instance Analytics
Instance Analytics shows how your site’s server is performing right now. You’ll see three charts:
- CPU Utilization — how busy the processor is.
- Memory Used % — how much RAM is in use.
- Disk Used % — how full storage is.
Everything adapts to light/dark mode, works on mobile, and supports preset and custom time ranges.

Open Instance Analytics
You can get to analytics in any of these ways:
-
🏠 Dashboard → Total Website Hosting Plan
Open the plan and click the Analytics icon on the site card. -
📂 Sidebar → Hosting → Website Hosting
Find your site in the list and click View Analytics. -
📈 Sidebar → Services → Analytics
Click the card for the site you want to inspect.
:::note Eligibility Analytics are available for purchased plans only (not for free web pages or free trials). :::
Quick start
- 🧭 Open the analytics page using any method above.
- ⏱️ Pick a time range in the top-right:
- Presets: 1h, 3h, 12h, 1d, 3d, 1w (loads immediately)
- Custom: choose a Relative or Absolute range, then Apply
- 📊 Review the charts for CPU, Memory, and Disk.
Choosing a time range
Presets
Click any preset to load charts right away.
Custom
Click Custom to open the picker. It has two tabs:
- Relative
- Absolute
Choose a unit (Minutes / Hours / Days / Weeks) and a value (for example, 10), then click Apply.
The button updates to your choice, e.g. Custom (10w) or Custom (6h).
Pick an exact Start and End date/time, then click Apply.
Times are interpreted in your local timezone and converted to a universal format on the backend.
:::tip Mobile friendly On phones, the Custom picker opens as a full-width bottom sheet. Scroll if needed, then Apply or Cancel. :::
Light & dark charts
- ☀️ / 🌙 Toggle the dashboard theme with the button in the header.
- When you Apply a time range, charts render in the current theme automatically.
What the charts mean
-
⚙️ CPU Utilization
High spikes mean your server is busy. Short spikes are fine; long periods of high CPU can indicate heavy traffic or intensive tasks.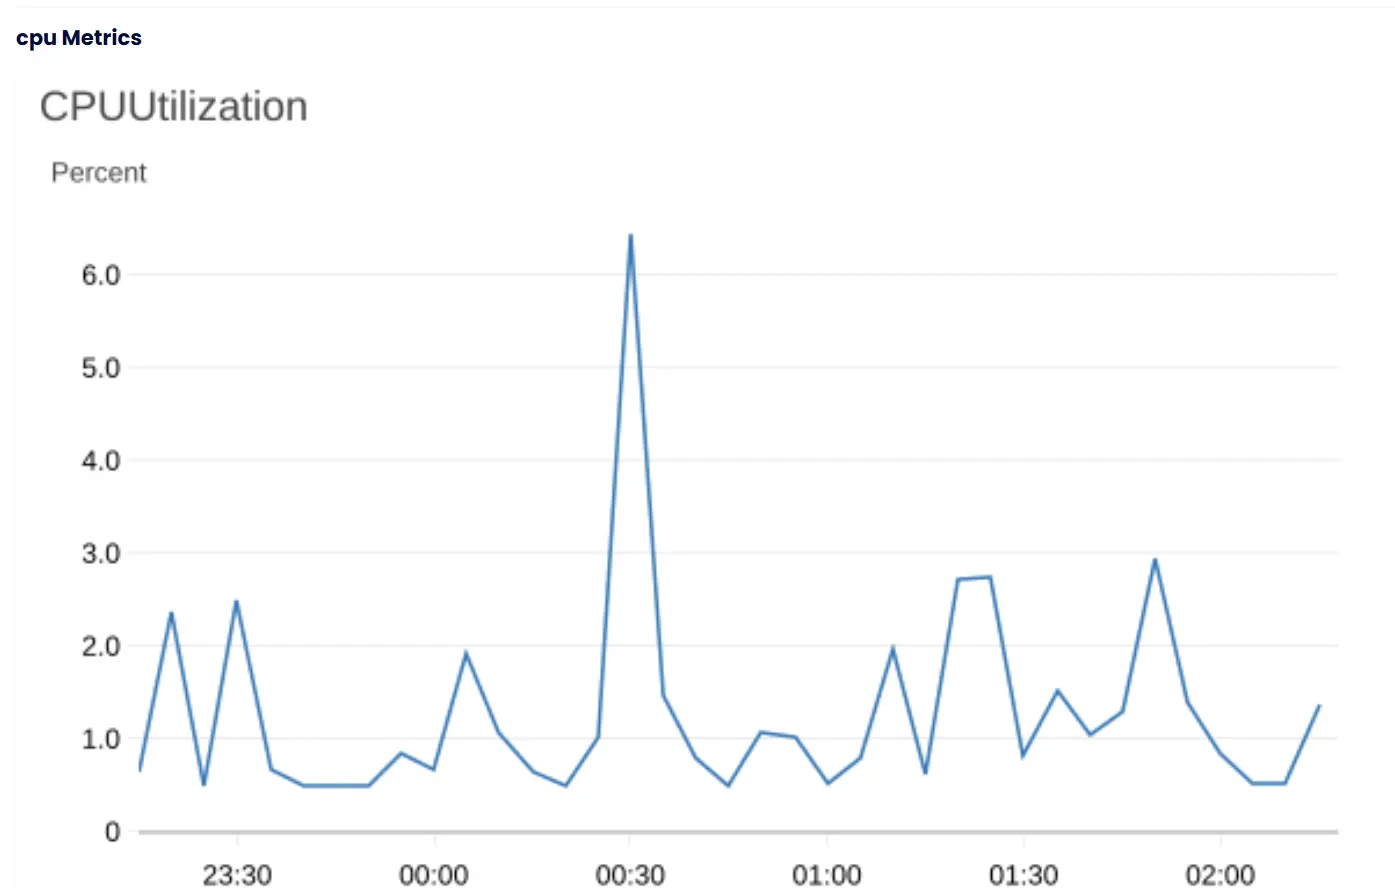
-
💾 Memory Used %
Shows how much RAM is in use. Consistently high values can slow down your site and may require optimization or more memory.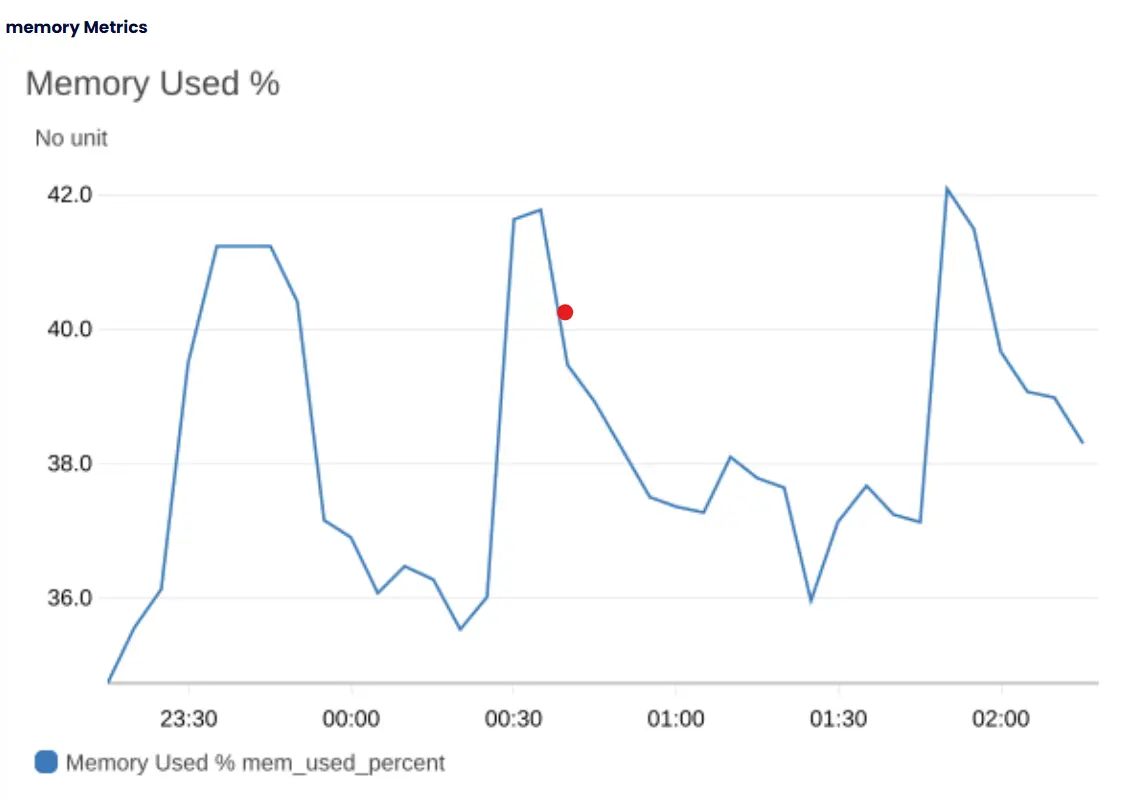
-
🗄️ Disk Used %
Shows how full your storage is. Watch for values near 100%—running out of space can cause errors.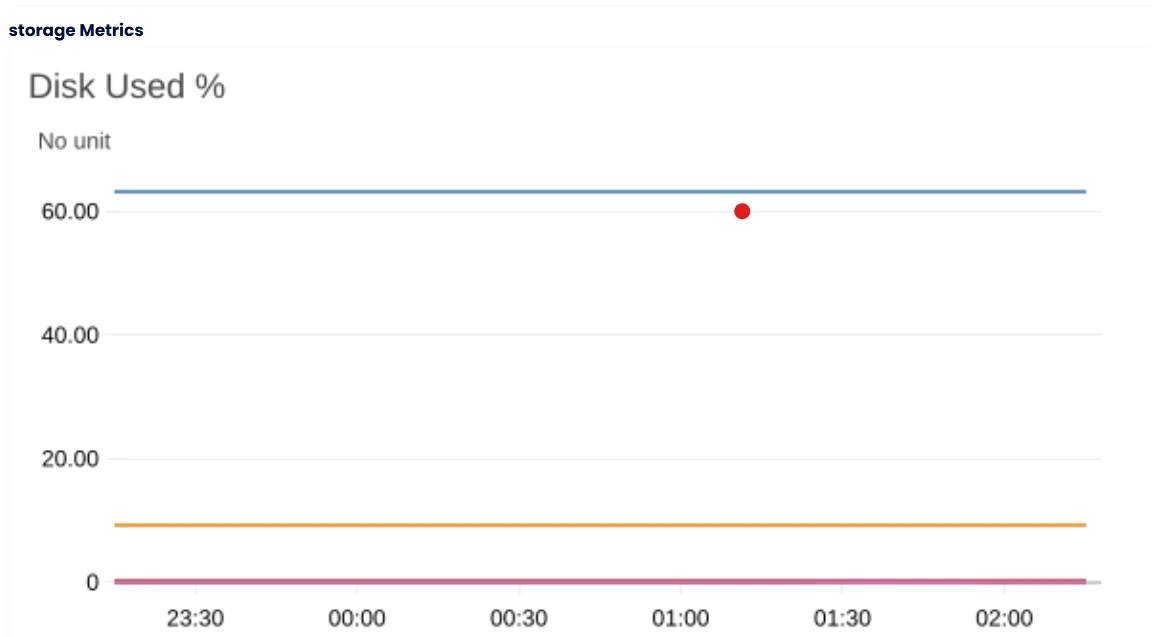
Troubleshooting
-
“Memory/Disk not available.”
Ensure CloudMySite Monitoring is enabled for the site. If you just enabled it, wait a few minutes and try again. -
“Custom” label doesn’t match my new selection.
The label reflects the last applied custom range. After changing values, click Apply. -
Why can’t I pick a future time?
Analytics cover past and current activity only.
Accessibility
- Keyboard friendly: use Tab to move, Enter/Space to activate.
- The custom picker opens as a dialog with clear labels and buttons.
- Dark mode uses high-contrast colors for readability.
Privacy & security
- Analytics images are generated by the CloudMySite platform and delivered to your dashboard.
- Your browser does not need or receive third-party service keys.
FAQ
Do charts auto-refresh?
Use a preset or Custom → Apply to refresh with a new range. (Auto-refresh is planned.)
Will changing themes reload the charts?
Charts render in the current theme when you apply a range. After switching themes, just apply a range again.
Can I download the images?
Right-click a chart and choose Save image as… (export options are planned).
Tips for healthy sites
- ⚙️ If CPU is frequently above ~80% for long periods, reduce heavy tasks or scale resources.
- 💾 If Memory Used % stays above ~85%, consider optimizing apps or increasing memory.
- 🗄️ If Disk Used % reaches 90–95%, free space or expand storage to avoid interruptions.
Changelog (highlights)
- New Custom time picker with Relative and Absolute ranges
- Mobile bottom-sheet experience for the picker
- Custom (…) label shows your applied custom range
- Charts honor Light/Dark dashboard theme