Analytics Reports
The Analytics Reports page explains how to read the detailed reporting sections inside the Newsletter Analytics dashboard.
These reports help users understand the complete journey of a campaign:
Sent
→ Delivered
→ Opened
→ Clicked
→ Unsubscribed or bounced
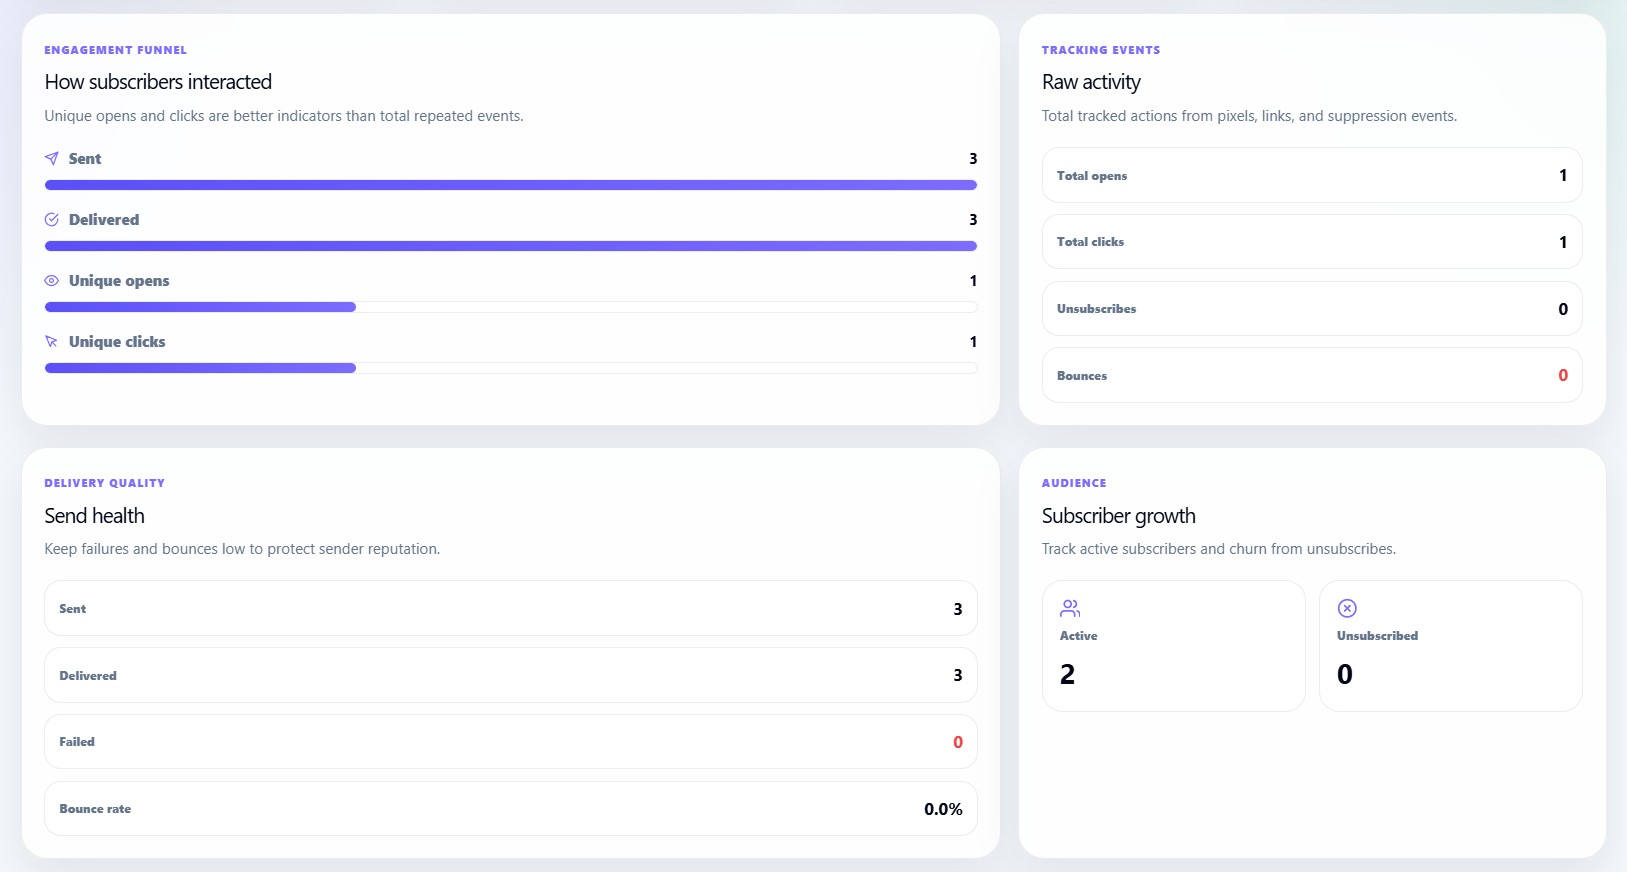
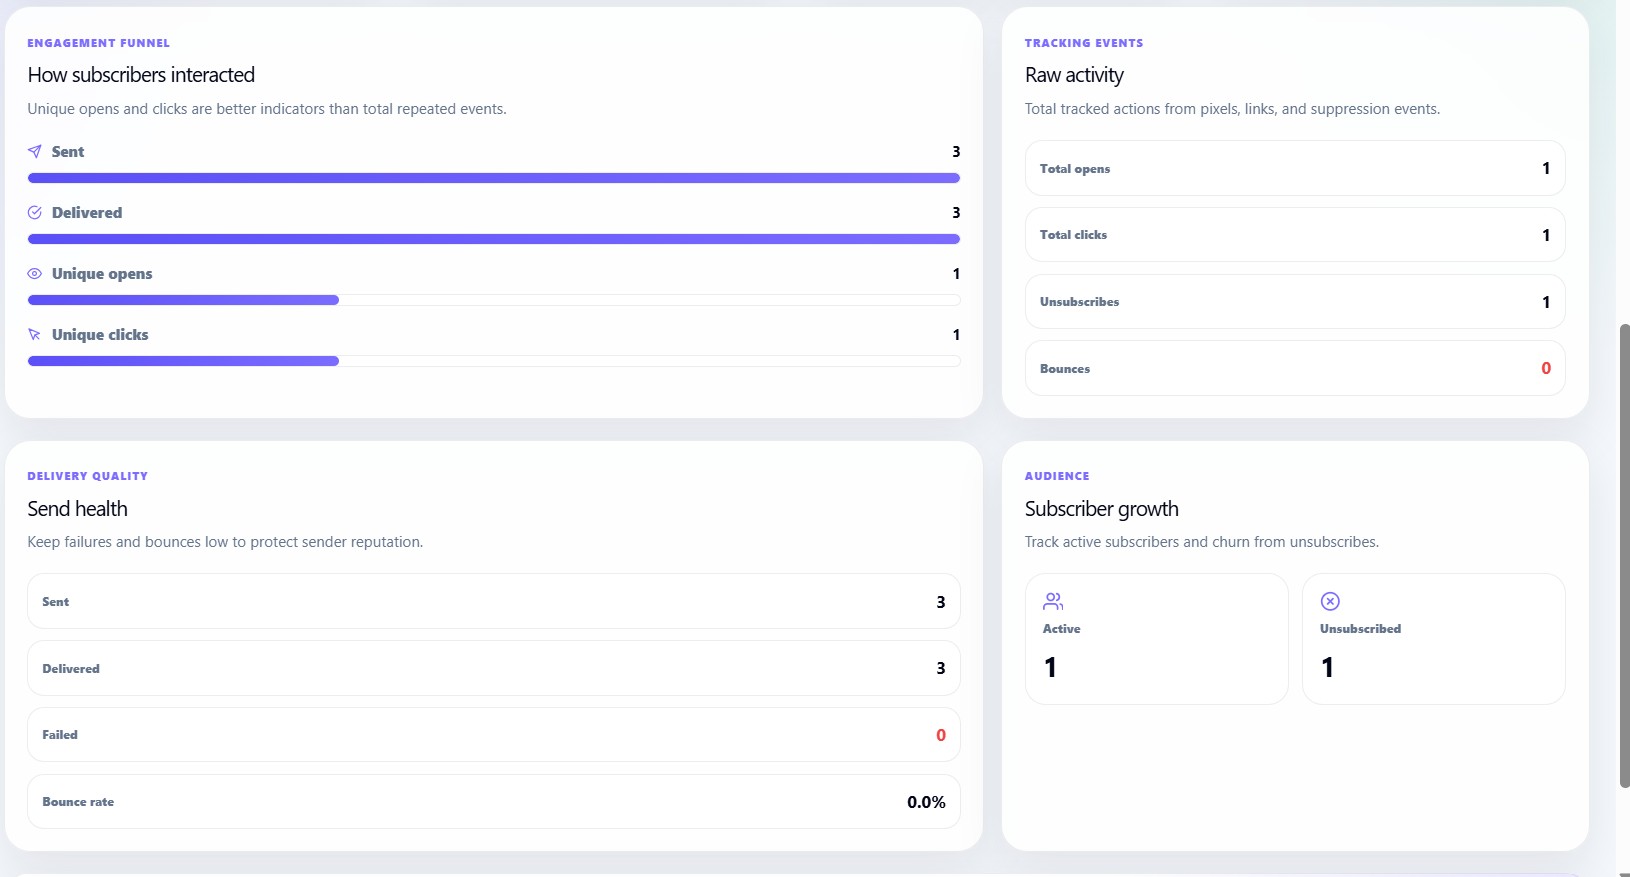
Engagement funnel
The Engagement Funnel shows how subscribers interacted with a campaign.
It displays:
| Funnel Step | Meaning |
|---|---|
| Sent | Total emails sent |
| Delivered | Emails successfully delivered |
| Unique Opens | Individual subscribers who opened the email |
| Unique Clicks | Individual subscribers who clicked links |
Why the funnel is useful
The funnel helps users identify where performance drops.
For example:
- If sent is high but delivered is low, delivery quality may be poor.
- If delivered is high but opens are low, subject lines may need improvement.
- If opens are high but clicks are low, CTA placement or link copy may need improvement.
Unique opens and unique clicks
The dashboard focuses on unique activity because it gives a clearer picture of real audience engagement.
| Metric | Meaning |
|---|---|
| Total opens | All open events, including repeated opens |
| Unique opens | Individual subscribers who opened |
| Total clicks | All click events, including repeated clicks |
| Unique clicks | Individual subscribers who clicked |
Raw activity report
The Raw Activity section shows total tracked actions.
It includes:
- Total opens
- Total clicks
- Unsubscribes
- Bounces
This section helps users understand the total amount of activity recorded by tracking pixels, links, and unsubscribe/bounce events.
Delivery quality report
The Delivery Quality section focuses on sending health.
It displays:
- Sent
- Delivered
- Failed
- Bounce rate
Understanding failed sends
Failed sends are emails that could not be delivered by the system.
Possible reasons include:
- Invalid email address
- Mailbox unavailable
- Suppression or block
- Temporary delivery issue
Understanding bounce rate
Bounce rate shows how many emails bounced compared with the total send.
High bounce rate can hurt sender reputation, so users should clean their list when bounce rate rises.
Audience growth report
The Audience section shows subscriber movement.
It displays:
- Active subscribers
- Unsubscribed subscribers
This helps users understand audience growth and churn.
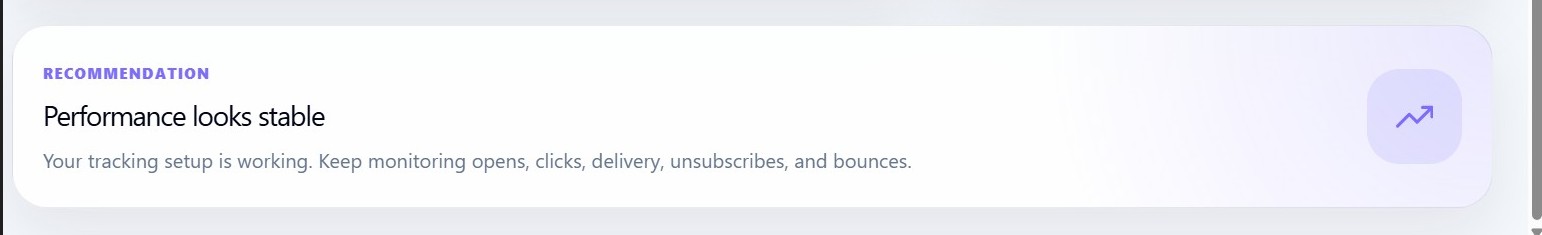
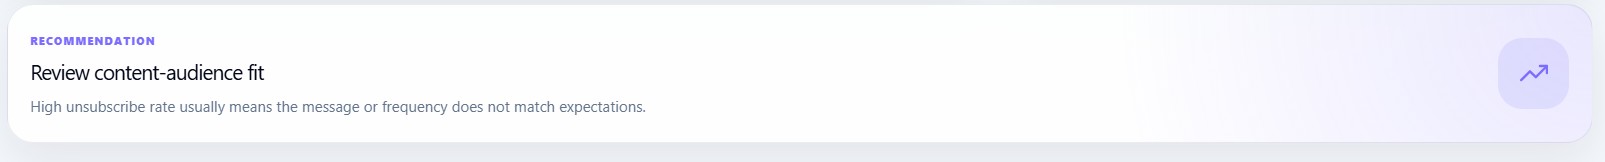
Recommendations card
The Analytics page includes a recommendation section that changes based on performance.
The dashboard can recommend:
| Condition | Recommendation |
|---|---|
| Low CTR | Improve CTA placement and link clarity |
| High bounce rate | Clean your list before the next send |
| High unsubscribe rate | Review content-audience fit |
| Stable performance | Continue monitoring analytics |
Low CTR recommendation
If CTR is below a healthy level, users should:
- Place the main CTA higher in the email
- Use clearer button text
- Reduce too many competing links
- Make the offer or next step more obvious
High bounce recommendation
If bounce rate is high, users should:
- Remove invalid email addresses
- Avoid old or stale subscriber lists
- Import clean subscriber data only
- Regularly delete bounced contacts
High unsubscribe recommendation
If unsubscribe rate is high, users should review:
- Campaign frequency
- Audience expectations
- Email subject and content match
- Subscriber segmentation
Unsubscriber Analytics
The Unsubscriber Analytics section helps users track subscriber churn and unsubscribe activity.
It includes metrics such as:
- Total unsubscribes
- Unsubscribe rate
- Bounce-related removals
- Audience loss trends
This helps users identify whether campaign frequency, content quality, or audience targeting needs improvement.
Best practices for users
To improve newsletter analytics, users should:
- Keep subscriber lists clean.
- Send campaigns to relevant audiences.
- Use clear subject lines.
- Add one strong main call-to-action.
- Monitor unsubscribe and bounce rates.
- Review open and click data after every campaign.
- Improve templates based on engagement.