Analytics
The Analytics page is the performance center for the Newsletter dashboard. It helps users understand how their newsletter campaigns are performing by tracking delivery, opens, clicks, unsubscribes, bounces, and subscriber growth.
This page is designed like a clean performance dashboard where users can quickly understand:
- How many newsletters were sent
- How many were delivered
- How many people opened the campaign
- How many clicked links
- How many unsubscribed
- Whether the audience list is healthy
- Whether sending performance needs attention
Analytics loading flow

When the Analytics page opens, it checks for the connected newsletter accountId.
If the account is available, the dashboard loads analytics data from:
/api/analytics?accountId=ACCOUNT_ID
The request uses:
GET
cache: no-store
This means the page always tries to load fresh analytics instead of showing old cached campaign data.
When analytics are loading
While data is loading, the user sees a loading card:
Loading analytics...
This prevents empty or broken UI while the system fetches performance data.
When no analytics exist yet
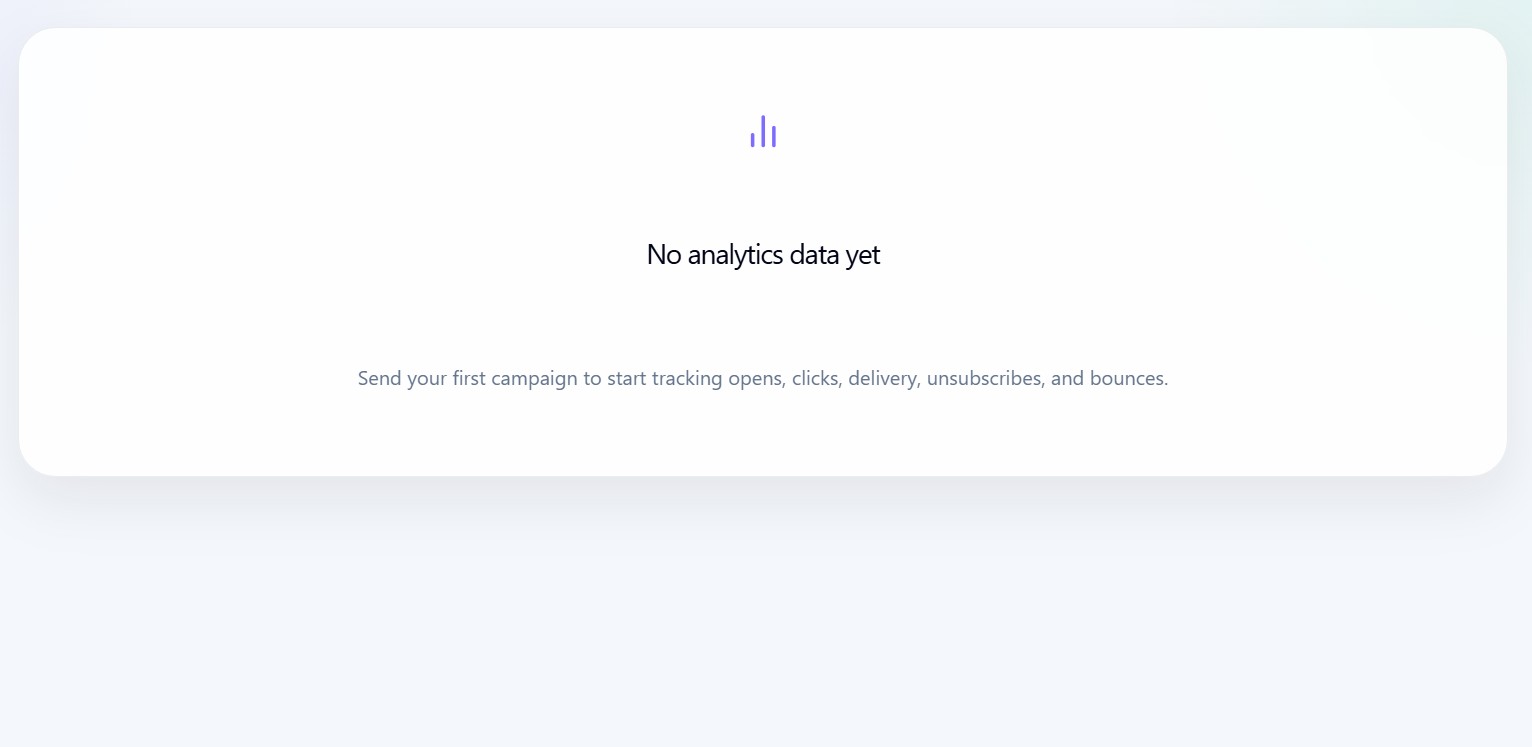
If no analytics data exists, the dashboard shows:
No analytics data yet
This usually means the user has not sent their first newsletter campaign yet.
The user should create and send a campaign before expecting open, click, delivery, unsubscribe, and bounce metrics.
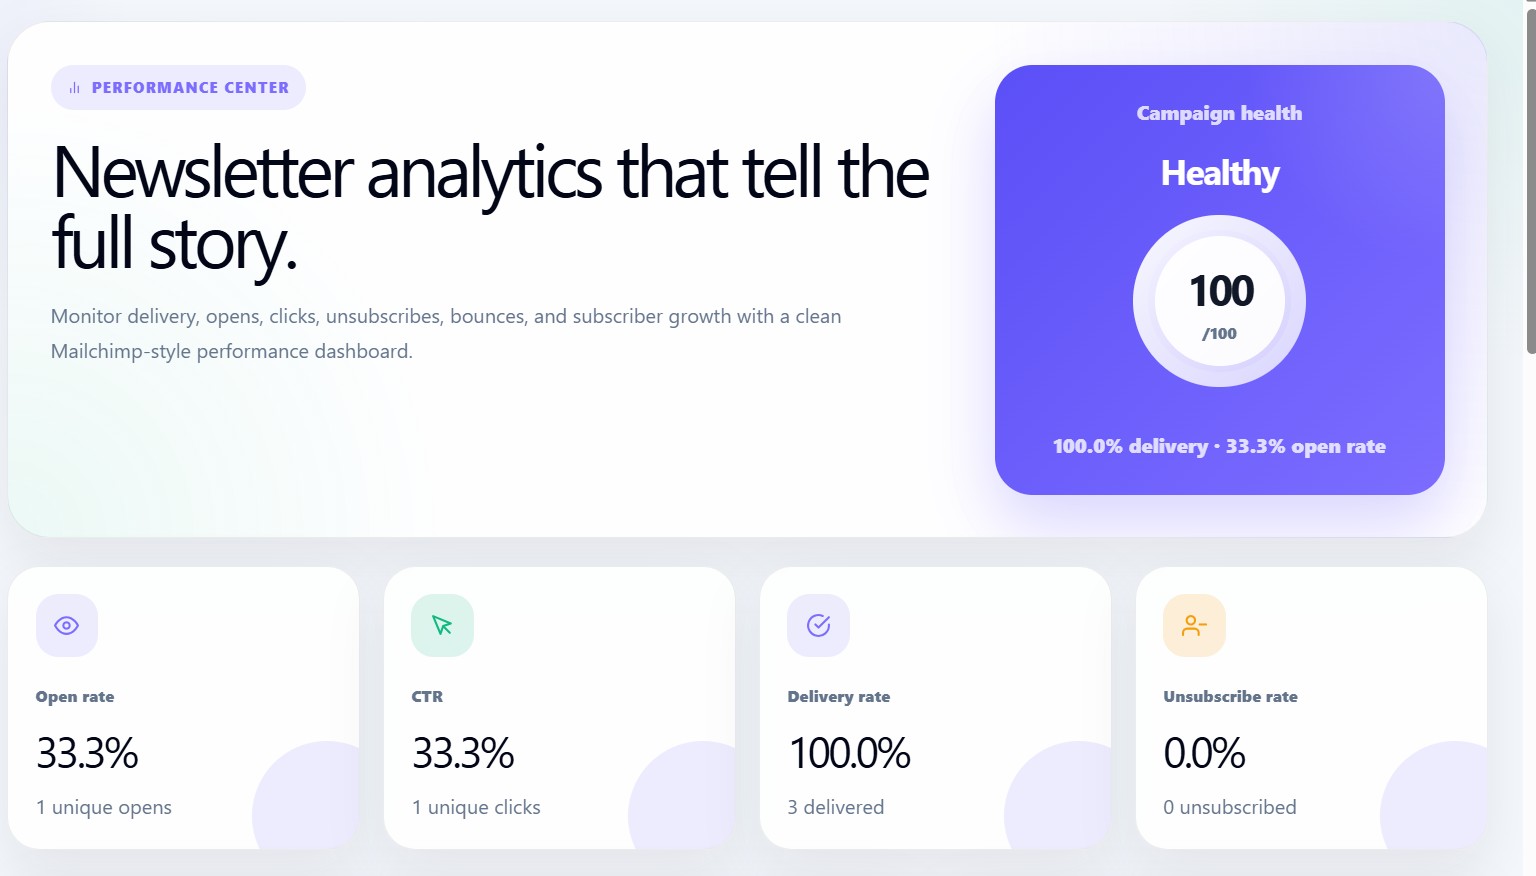
Analytics dashboard hero

The hero section introduces the page as the Performance Center.
It explains that the user can monitor:
- Delivery
- Opens
- Clicks
- Unsubscribes
- Bounces
- Subscriber growth
This gives the user a high-level view of newsletter performance before they inspect detailed metrics.
Campaign health card
The right side of the hero contains the Campaign Health card.
It shows:
- Health label
- Score out of 100
- Delivery rate
- Open rate
Health labels
The dashboard automatically assigns a health label based on delivery, open rate, click-through rate, bounce rate, and unsubscribe rate.
| Health Label | Meaning |
|---|---|
| Excellent | Delivery is high, open rate is strong, and CTR is strong |
| Healthy | Delivery and open rate are performing well |
| Needs cleanup | Bounce rate or unsubscribe rate is too high |
| Needs attention | Metrics are below ideal performance levels |
| No data | Analytics data is not available yet |
Campaign health score
The score is calculated from multiple campaign health indicators.
The formula gives more importance to:
- Delivery rate
- Open rate
- Click-through rate
It subtracts score for:
- Bounce rate
- Unsubscribe rate
This makes the score useful for quickly understanding whether the newsletter performance is stable or needs improvement.
Main KPI cards
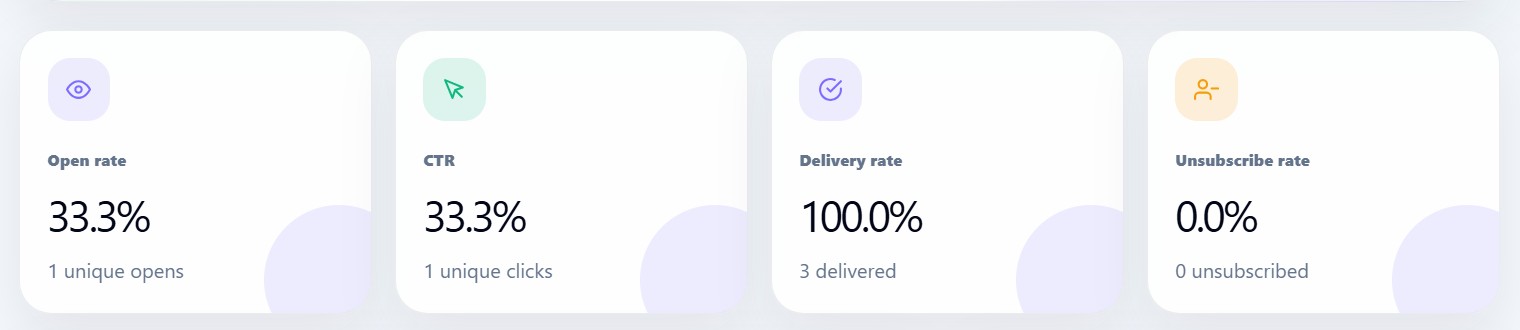
The Analytics page displays four main KPI cards:
| KPI | Description |
|---|---|
| Open Rate | Percentage of delivered subscribers who opened the email |
| CTR | Click-through rate based on unique clicks |
| Delivery Rate | Percentage of sent emails successfully delivered |
| Unsubscribe Rate | Percentage of users who unsubscribed |
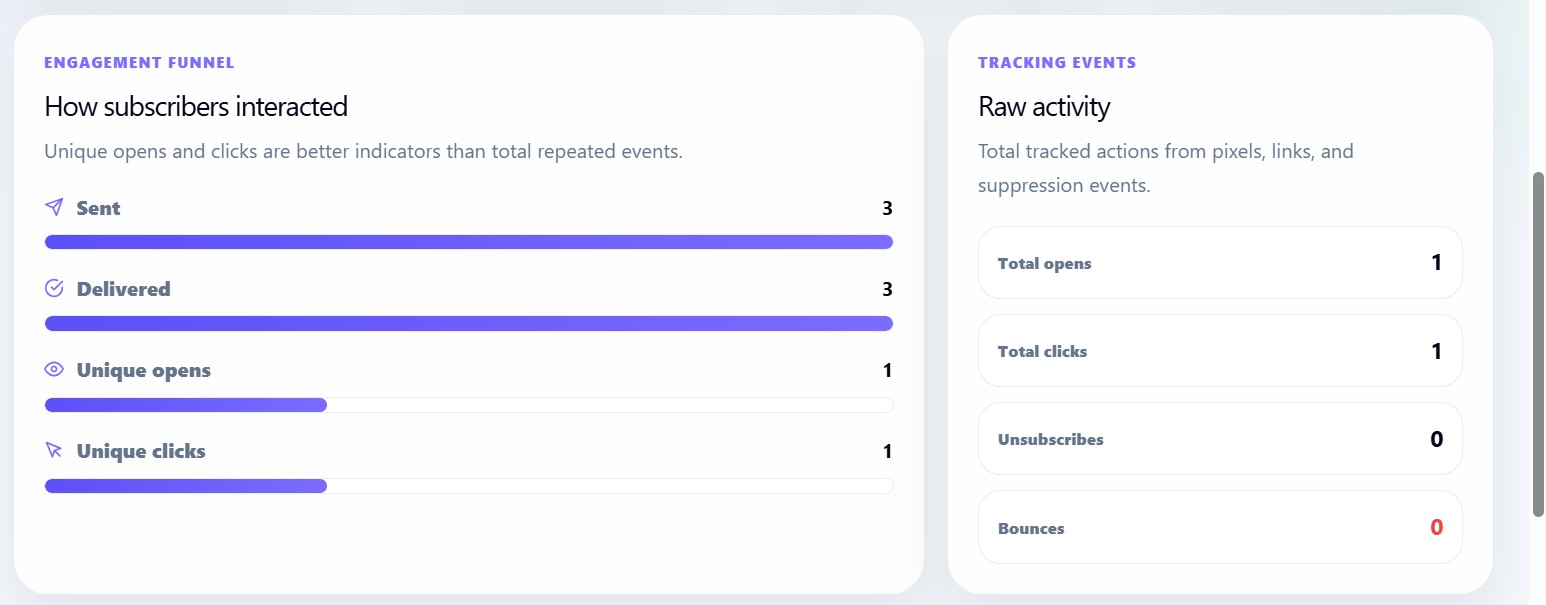
Open rate card
The Open Rate card shows how many people opened the newsletter.
It also displays:
Unique opens
Unique opens are important because they count individual subscribers instead of repeated opens by the same person.
CTR card
The CTR card shows how many subscribers clicked links in the email.
It also displays:
Unique clicks
Unique clicks help measure real engagement with the content and call-to-action.
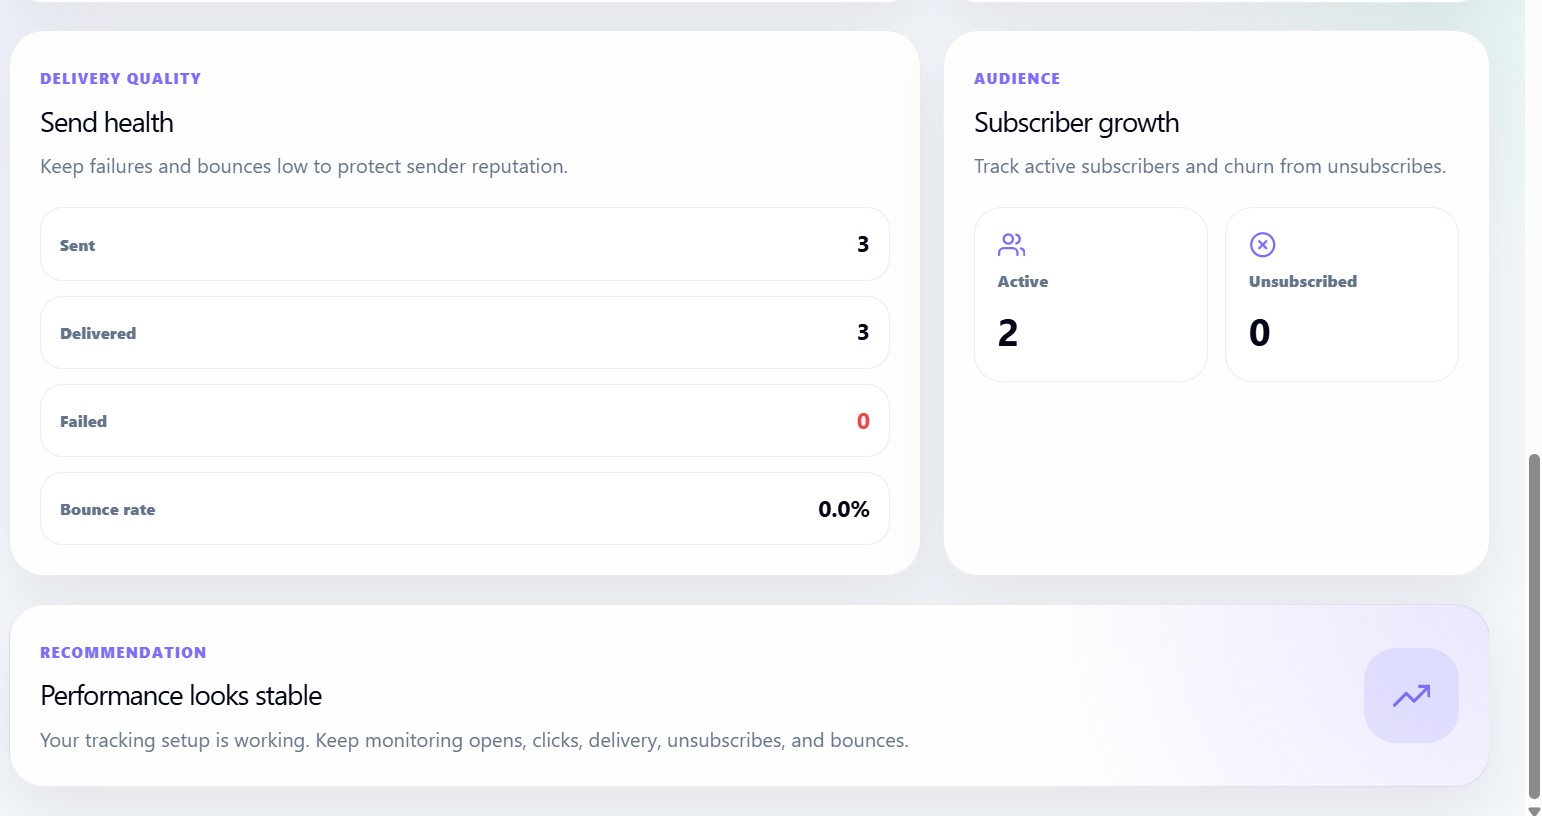
Delivery rate card
The Delivery Rate card shows how successfully emails reached subscriber inboxes.
A high delivery rate means the list and sending quality are healthy.
Unsubscribe rate card
The Unsubscribe Rate card shows how many people opted out after receiving campaigns.
A high unsubscribe rate may mean:
- Content does not match expectations
- Campaigns are being sent too often
- Audience targeting needs improvement